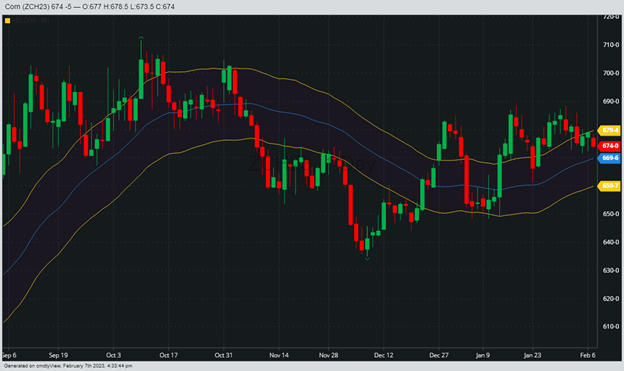
January 12 WASDE numbers for corn saw the market respond with initial sell off and then rally. Early the following week, after 3 day market holiday, March corn futures managed to post a high for the move, 688 ¾.
The following Monday, Jan 23, just 4 days later March corn futures then posted a low trade of 661 ¼. This was below the close of 671 from Jan 12, the day of the report. In spite of this technically bearish development, corn then traded up to test the recent high, meeting resistance at 688 ½.
We come into tomorrows report with March corn futures closing the day at 674, roughly 14 ¾ from the Jan 18 high and 2 ¾ below the 18 day moving average, 677 ¾. We have gone around the block to get to the house next door. Generic Trend Indicator shows the trend is UP with an upper band equal to 679, middle line 669 ¾ and lower band 659 ¾. 50 day moving average comes in at 665 for March corn futures.
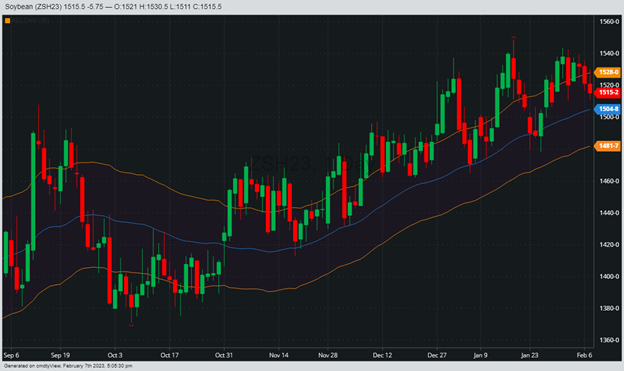
Beans recent tech action since Jan 12 WASDE:
March bean futures rallied on Jan 12 WASDE update. From Jan 12 to Jan 18 March soybean futures traded from 1493 up to a high of 1548 1/2. In the following 6 sessions beans had traded all the way back down to 1478 ¼. However, the Jan 25 close of 1502, up 14’0 on the day (not quite an outside day up, but close) set the stage for a test of the recent highs. March soybean futures managed to work higher until meeting resistance at 1543 ¾. Today’s close finds March soybean futures at 1515 1/4, 3 3/4 below the 18 day moving average, 1519. Generic Trend Indicator shows the trend UP. Upper band comes in at 1528, middle line 1505 and lower band 1481 ¾. 50 day moving average, 1493 ¼. 100 day moving average, 1459 ½. Much like corn, around the block to get to the house next door.
Futures trading involves substantial risk of loss.